
Custom SQL queries in Formant Analytics
This guide assumes knowledge of SQL. These tools can help you build a custom SQL query in Formant Analytics, but may require additional syntax review to achieve your desired visualization.
In addition to the built-in basic queries in Formant Analytics, you can also make custom queries to your database to present any data you want. You can achieve this using our built-in AI assistant, by building off of a basic query, or by constructing your own custom query.
This guide will teach you how to use the custom SQL editor in Formant Analytics.
Using the AI assistant
You can use the AI assistant in Formant Analytics to quickly generate custom SQL queries for more complex queries.
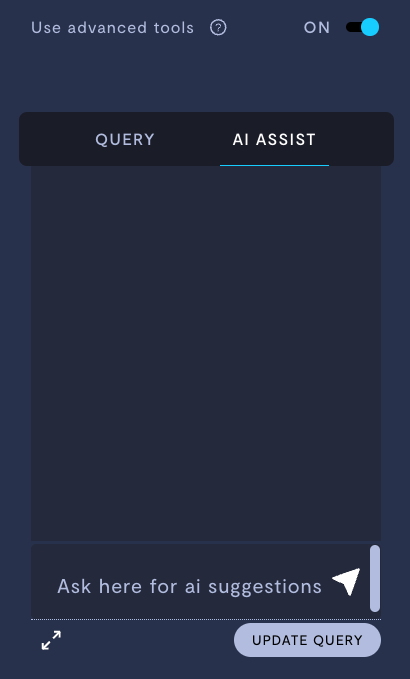
The AI assistant.
When using the AI assistant, you must specify both the stream name and type of stream you want to include in your query. You can find your stream name and type in Settings >> Streams.
For example, if you want to query the numeric set stream $.host.cpu, you must include the stream name and type in a query such as:
Show me the average of the numeric set stream "$.host.cpu" grouped by date
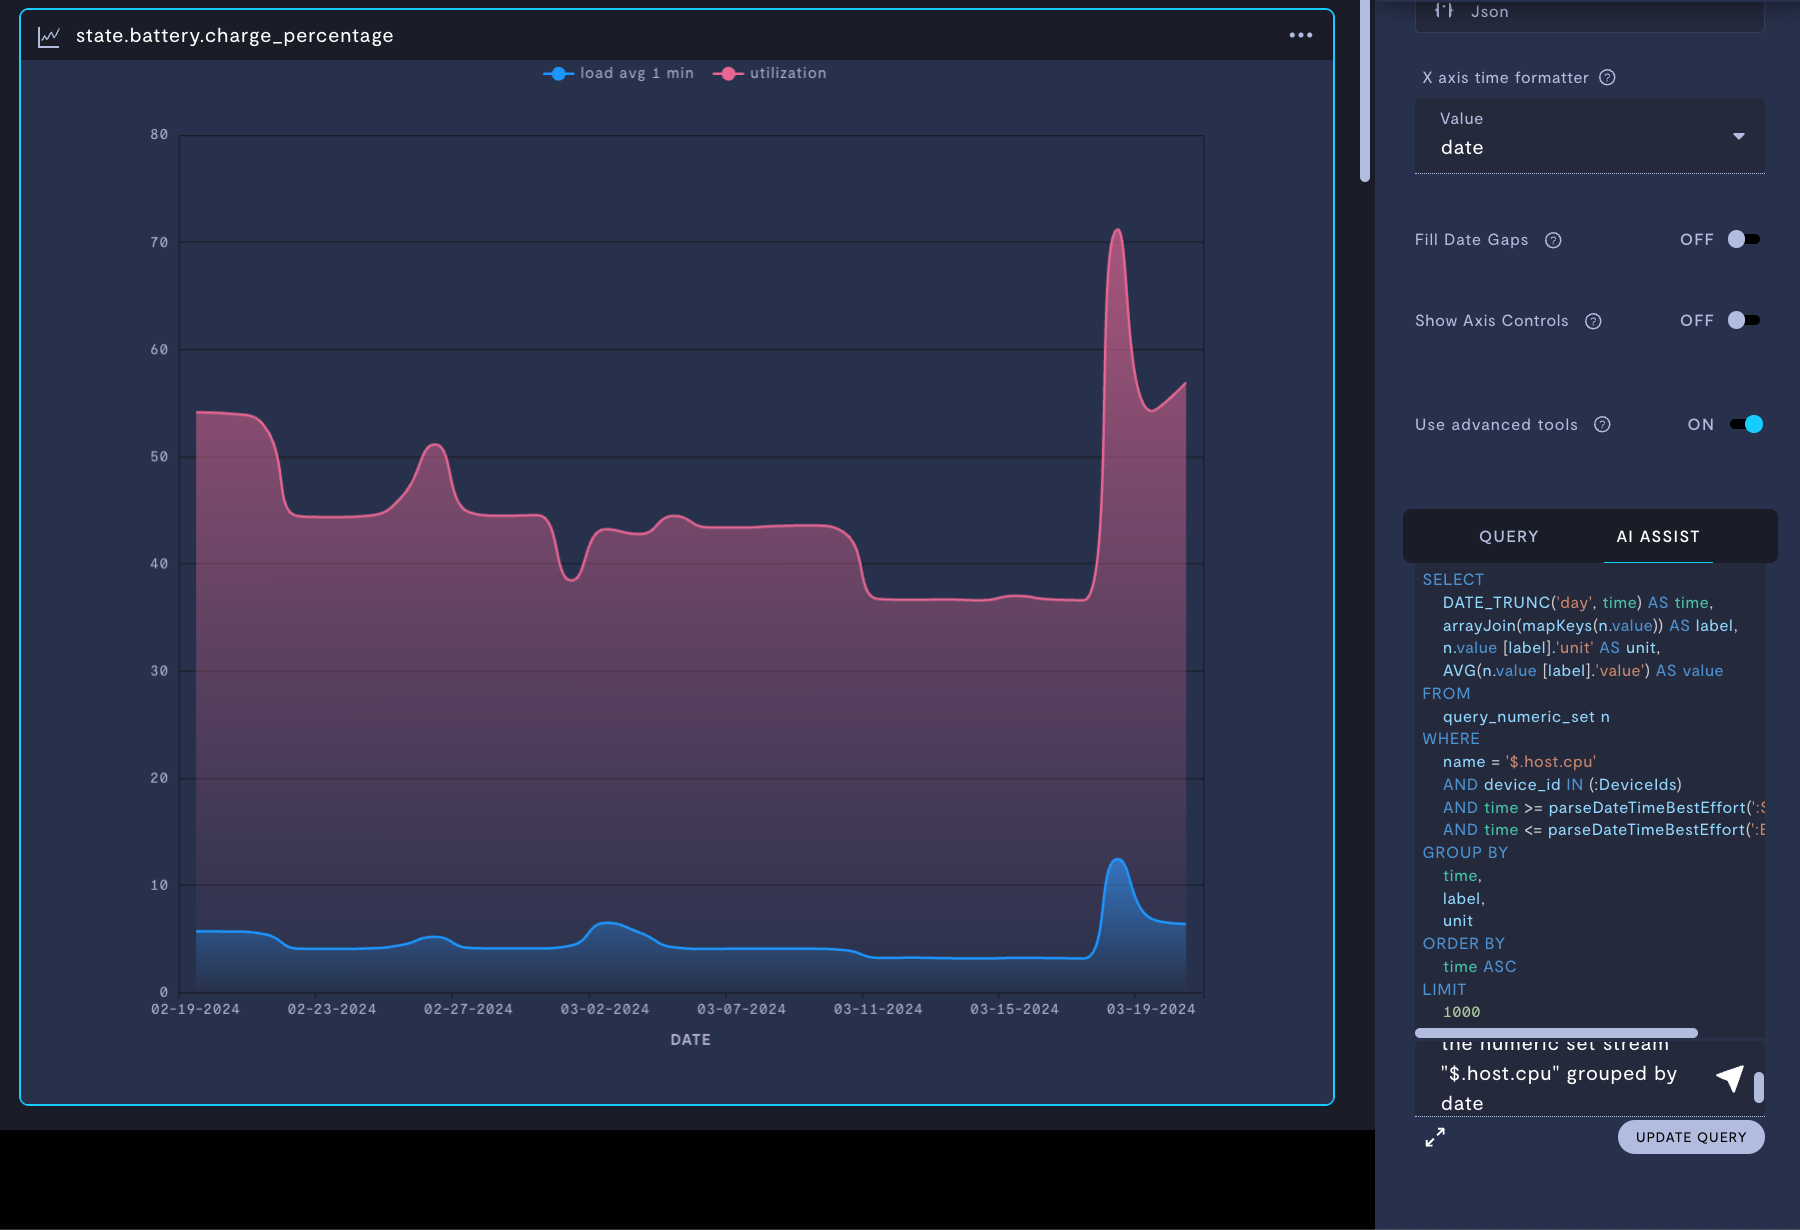
Executing an AI-generated query.
Building from a basic query
You can use the visualization options in the sidebar to build a basic query, and then customize that query.
As we saw in Create an Analytics view and add modules, when you first configure an analytics module, the sidebar will prompt you to add a data source, visualization, and aggregating function:
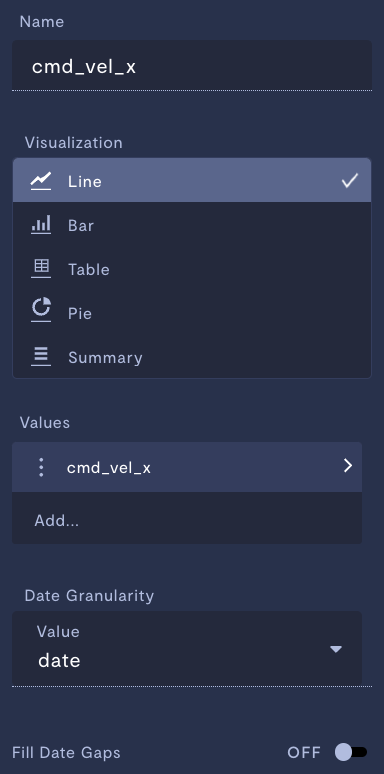
Sidebar configuration of an analytics module.
By clicking the Advanced button at the bottom of this menu, we can see the SQL query that is built from our selections:
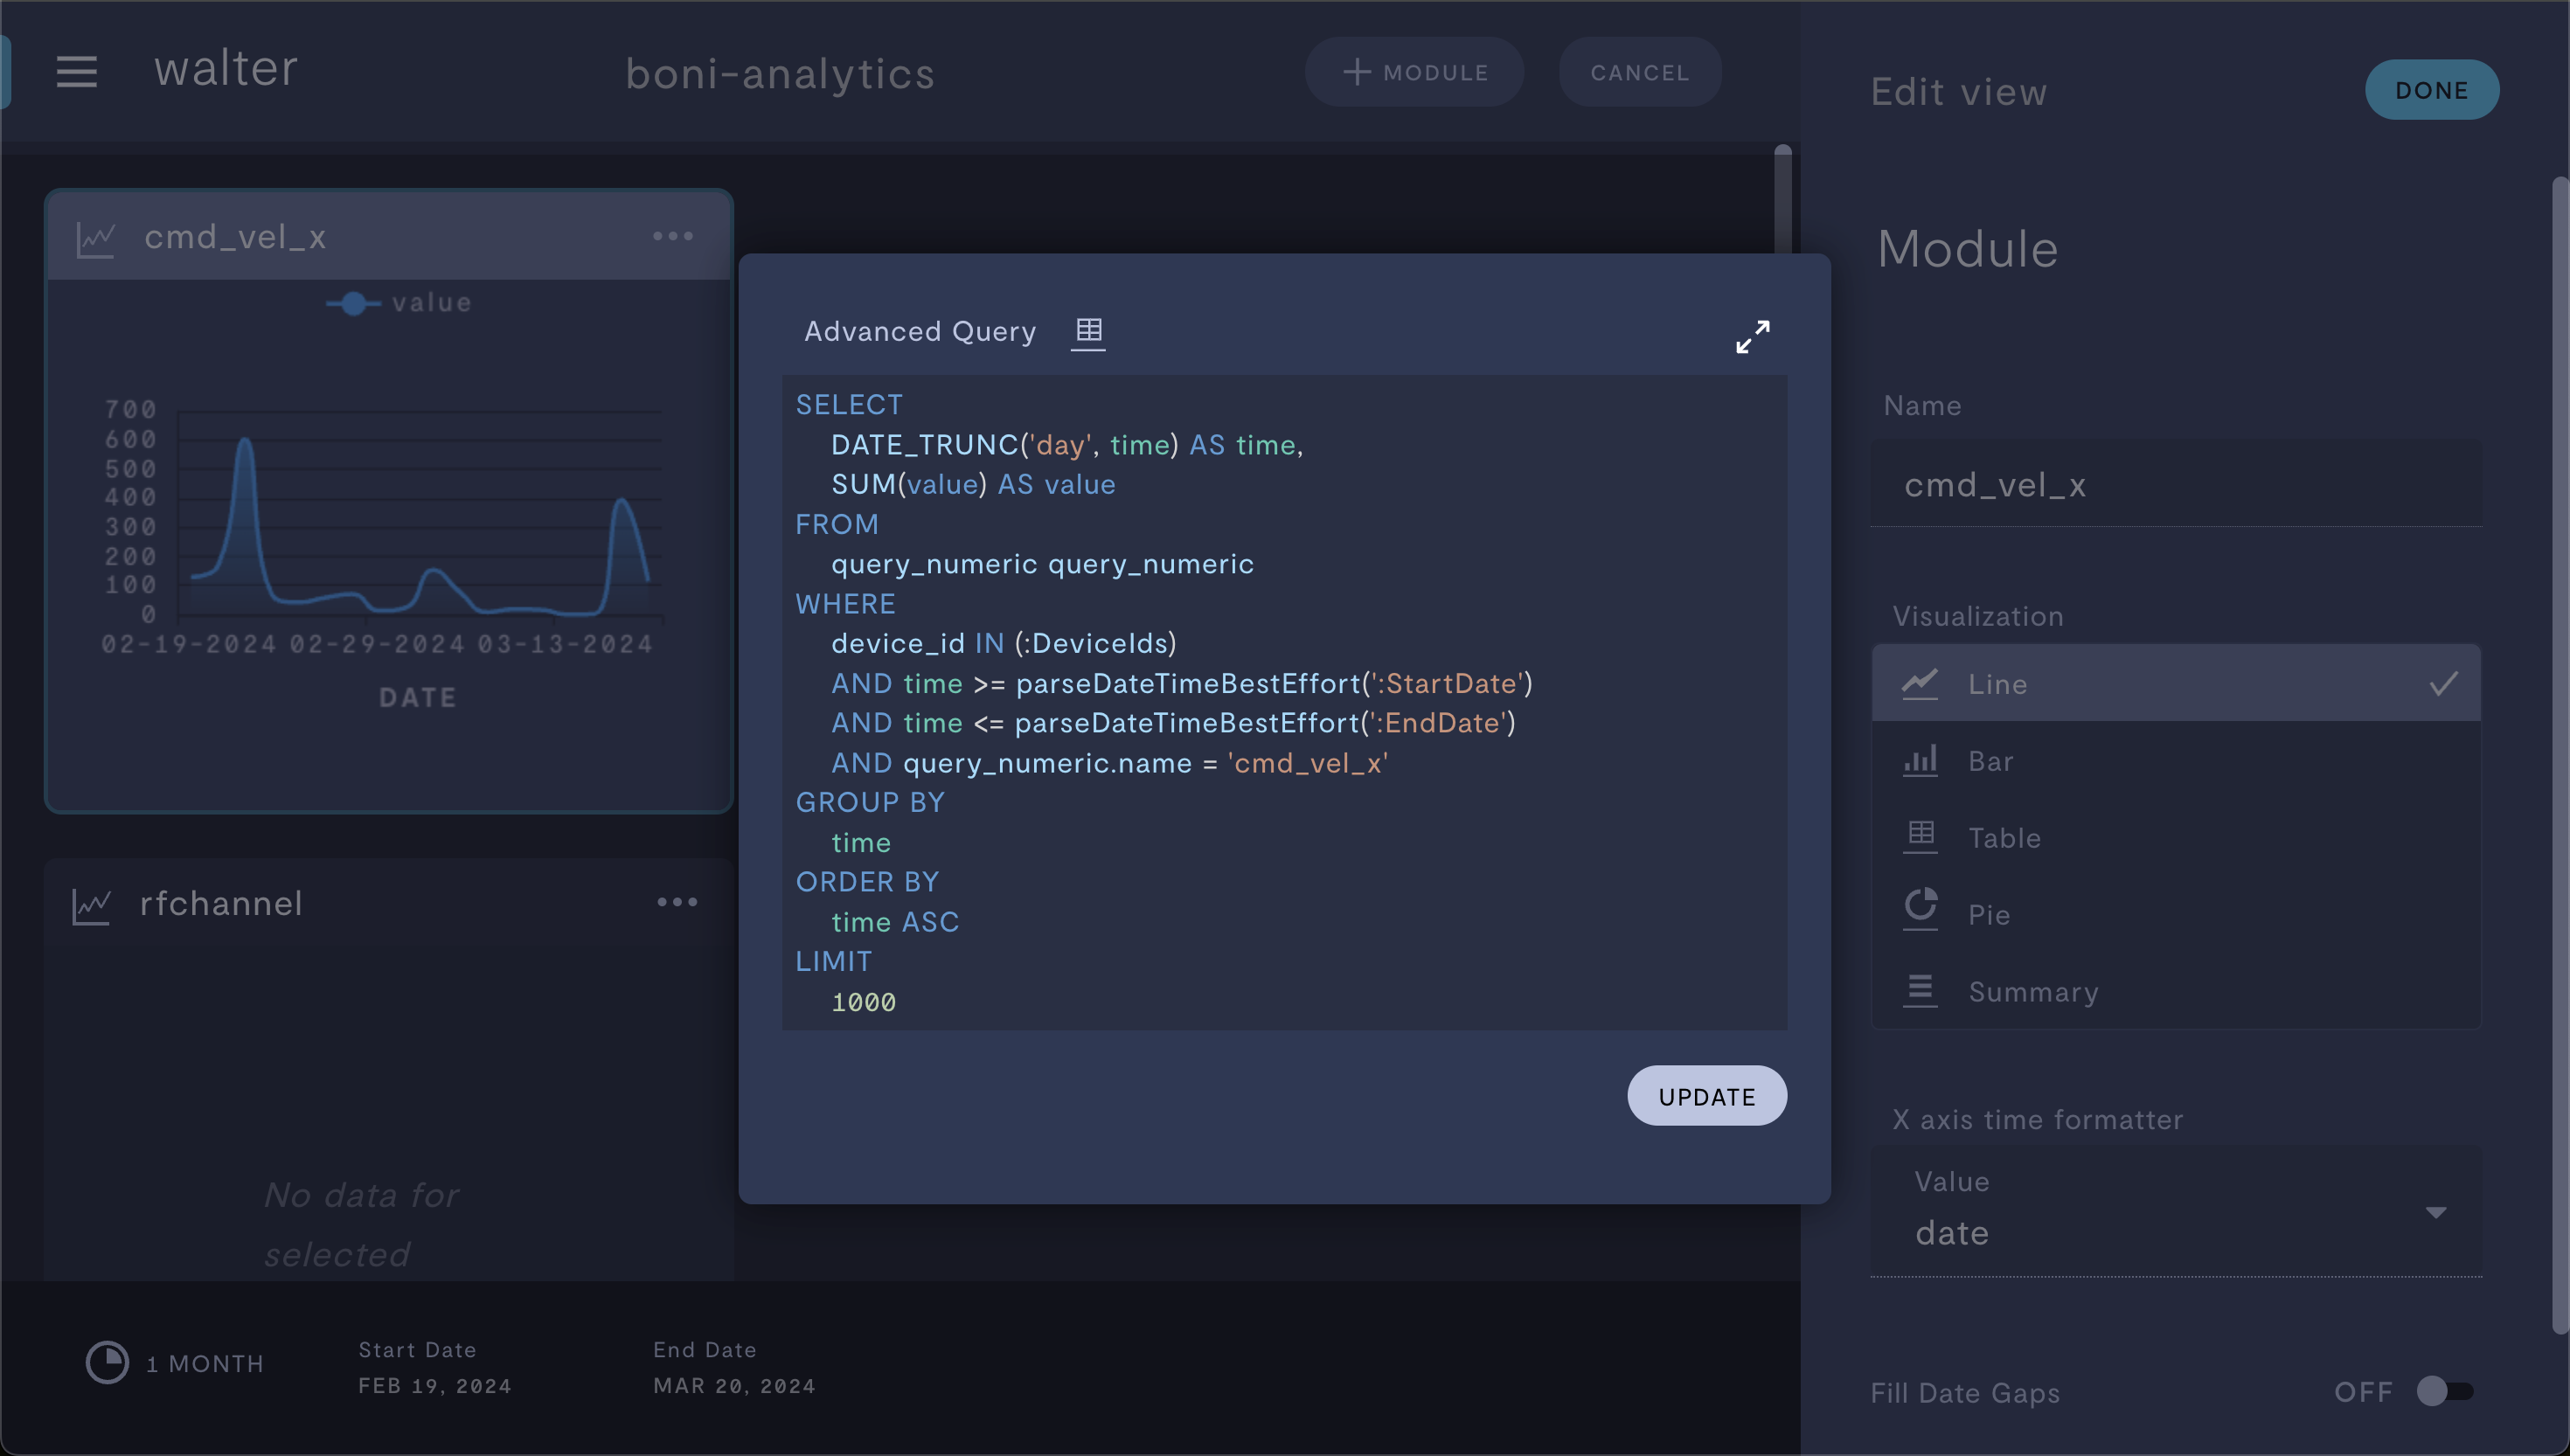
Customizing the basic query built in the sidebar.
You can edit this query as you see fit, and then click the Update button to visualize your changes.
Exploring your database structure
You can also write your own query from scratch, using the table visualizer in the Advanced Query window. Click the grid icon in the Advanced Query window to open the table visualizer:
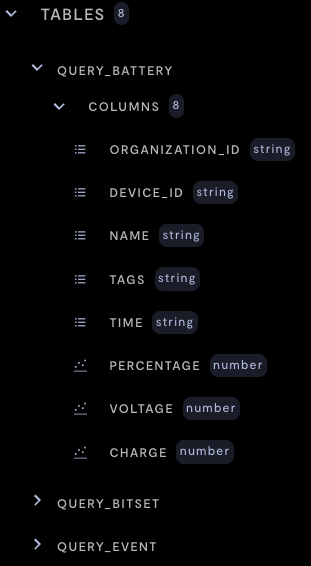
Inspecting the database structure using the table visualizer.
You can use this tool to understand each row and column in your database. Click the name of a column to copy that name to your clipboard, which you can then paste into the Advanced Query window.
X-axis customization
On your visualization
You can use the Show Axis Controls setting to customize your x-axis series and groupings.
| Property | Usage |
|---|---|
| X-axis column | Choose a column from your SQL query to be the x-axis of your visualization. |
| Partition by | Bin your data by this column, and then plot it on the x-axis column you selected |
In your SQL query
Basic queries in the sidebar always select time values to plot on the x-axis of your chart. You can use custom queries to use any data series for the x-axis of your chart, or to group data by values other than time denominations.
You can do this by modifying the SELECT and GROUP BY portions of your query. For example, if your dataset has a column called end_status which describes if a job was completed or canceled, you can group your data plot by end_status instead of time:
GROUP BY
end_status;
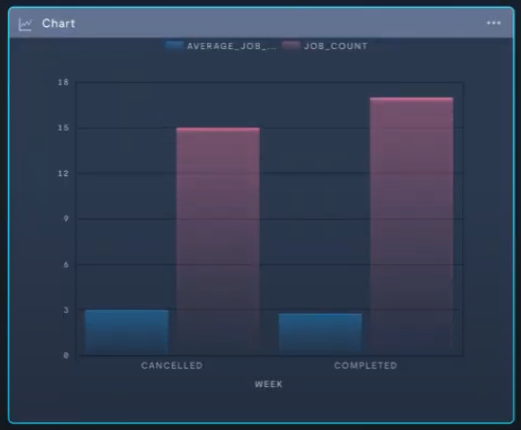
Grouping data by values other than time.
Examples
Multiple aggregating functions on same stream
Suppose we want to plot both the average and minimum values for a stream called state.battery.charge_percentage over a given timeframe. The basic interface only allows for one aggregating function per stream, so we will modify a basic query to achieve our desired plot.
- Create a new analytics module.
- In the Values list, add
state.battery.charge_percentage. - In the Values list, click on
state.battery.charge_percentageto open the aggregate window for that stream. - Set Aggregate to
avg. In the sidebar, click the back arrow. You should now see the average battery percentage for your device plotted over your selected time range:
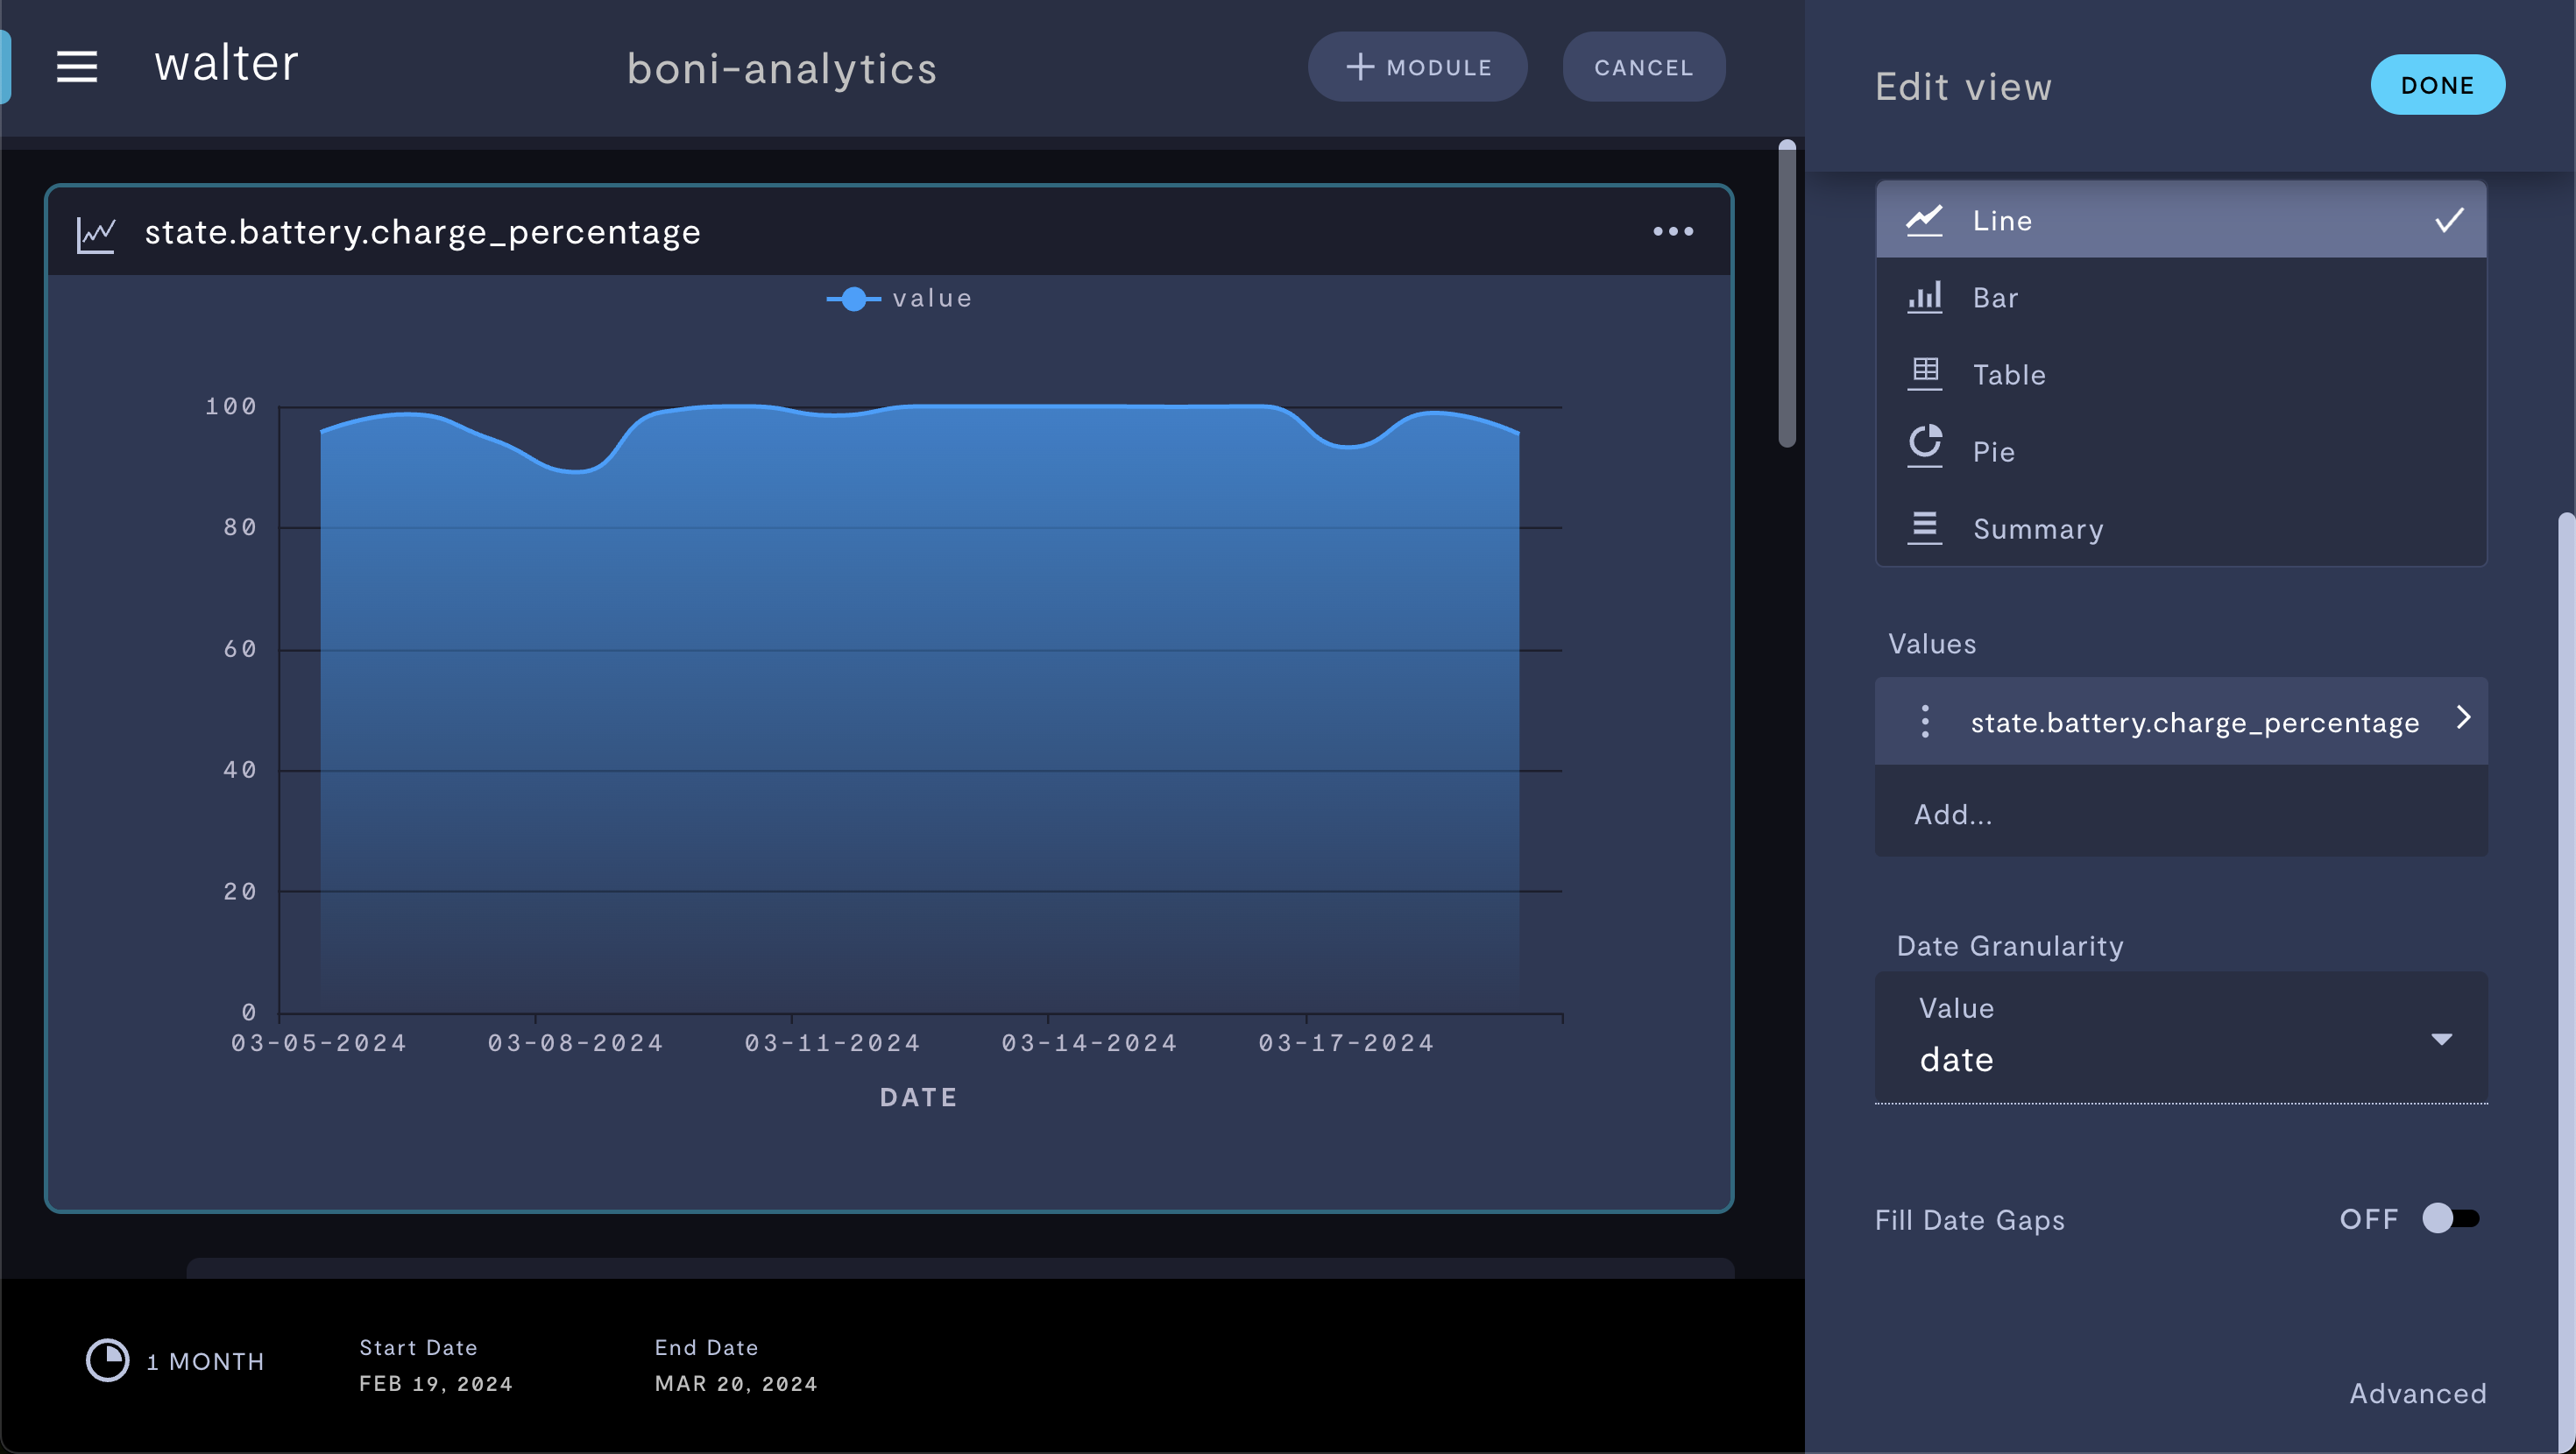
Basic query for average battery percentage.
- Scroll to the bottom of the sidebar and click Advanced. You will see the following query syntax:
SELECT
    DATE_TRUNC('day', time) AS time,
    AVG(value) AS value
FROM
    query_numeric query_numeric
WHERE
    device_id IN (:DeviceIds)
    AND time >= parseDateTimeBestEffort(':StartDate')
    AND time <= parseDateTimeBestEffort(':EndDate')
    AND query_numeric.name = 'state.battery.charge_percentage'
GROUP BY
    time
ORDER BY
    time ASC
LIMIT
    1000
Edit the SELECT section as follows:
SELECT
    DATE_TRUNC('day', time) AS time,
    AVG(value) AS "avg",
    MIN(value) AS "min"
- Click the Update button. You should now see the average and minimum battery percentages for your device plotted over your selected time range:
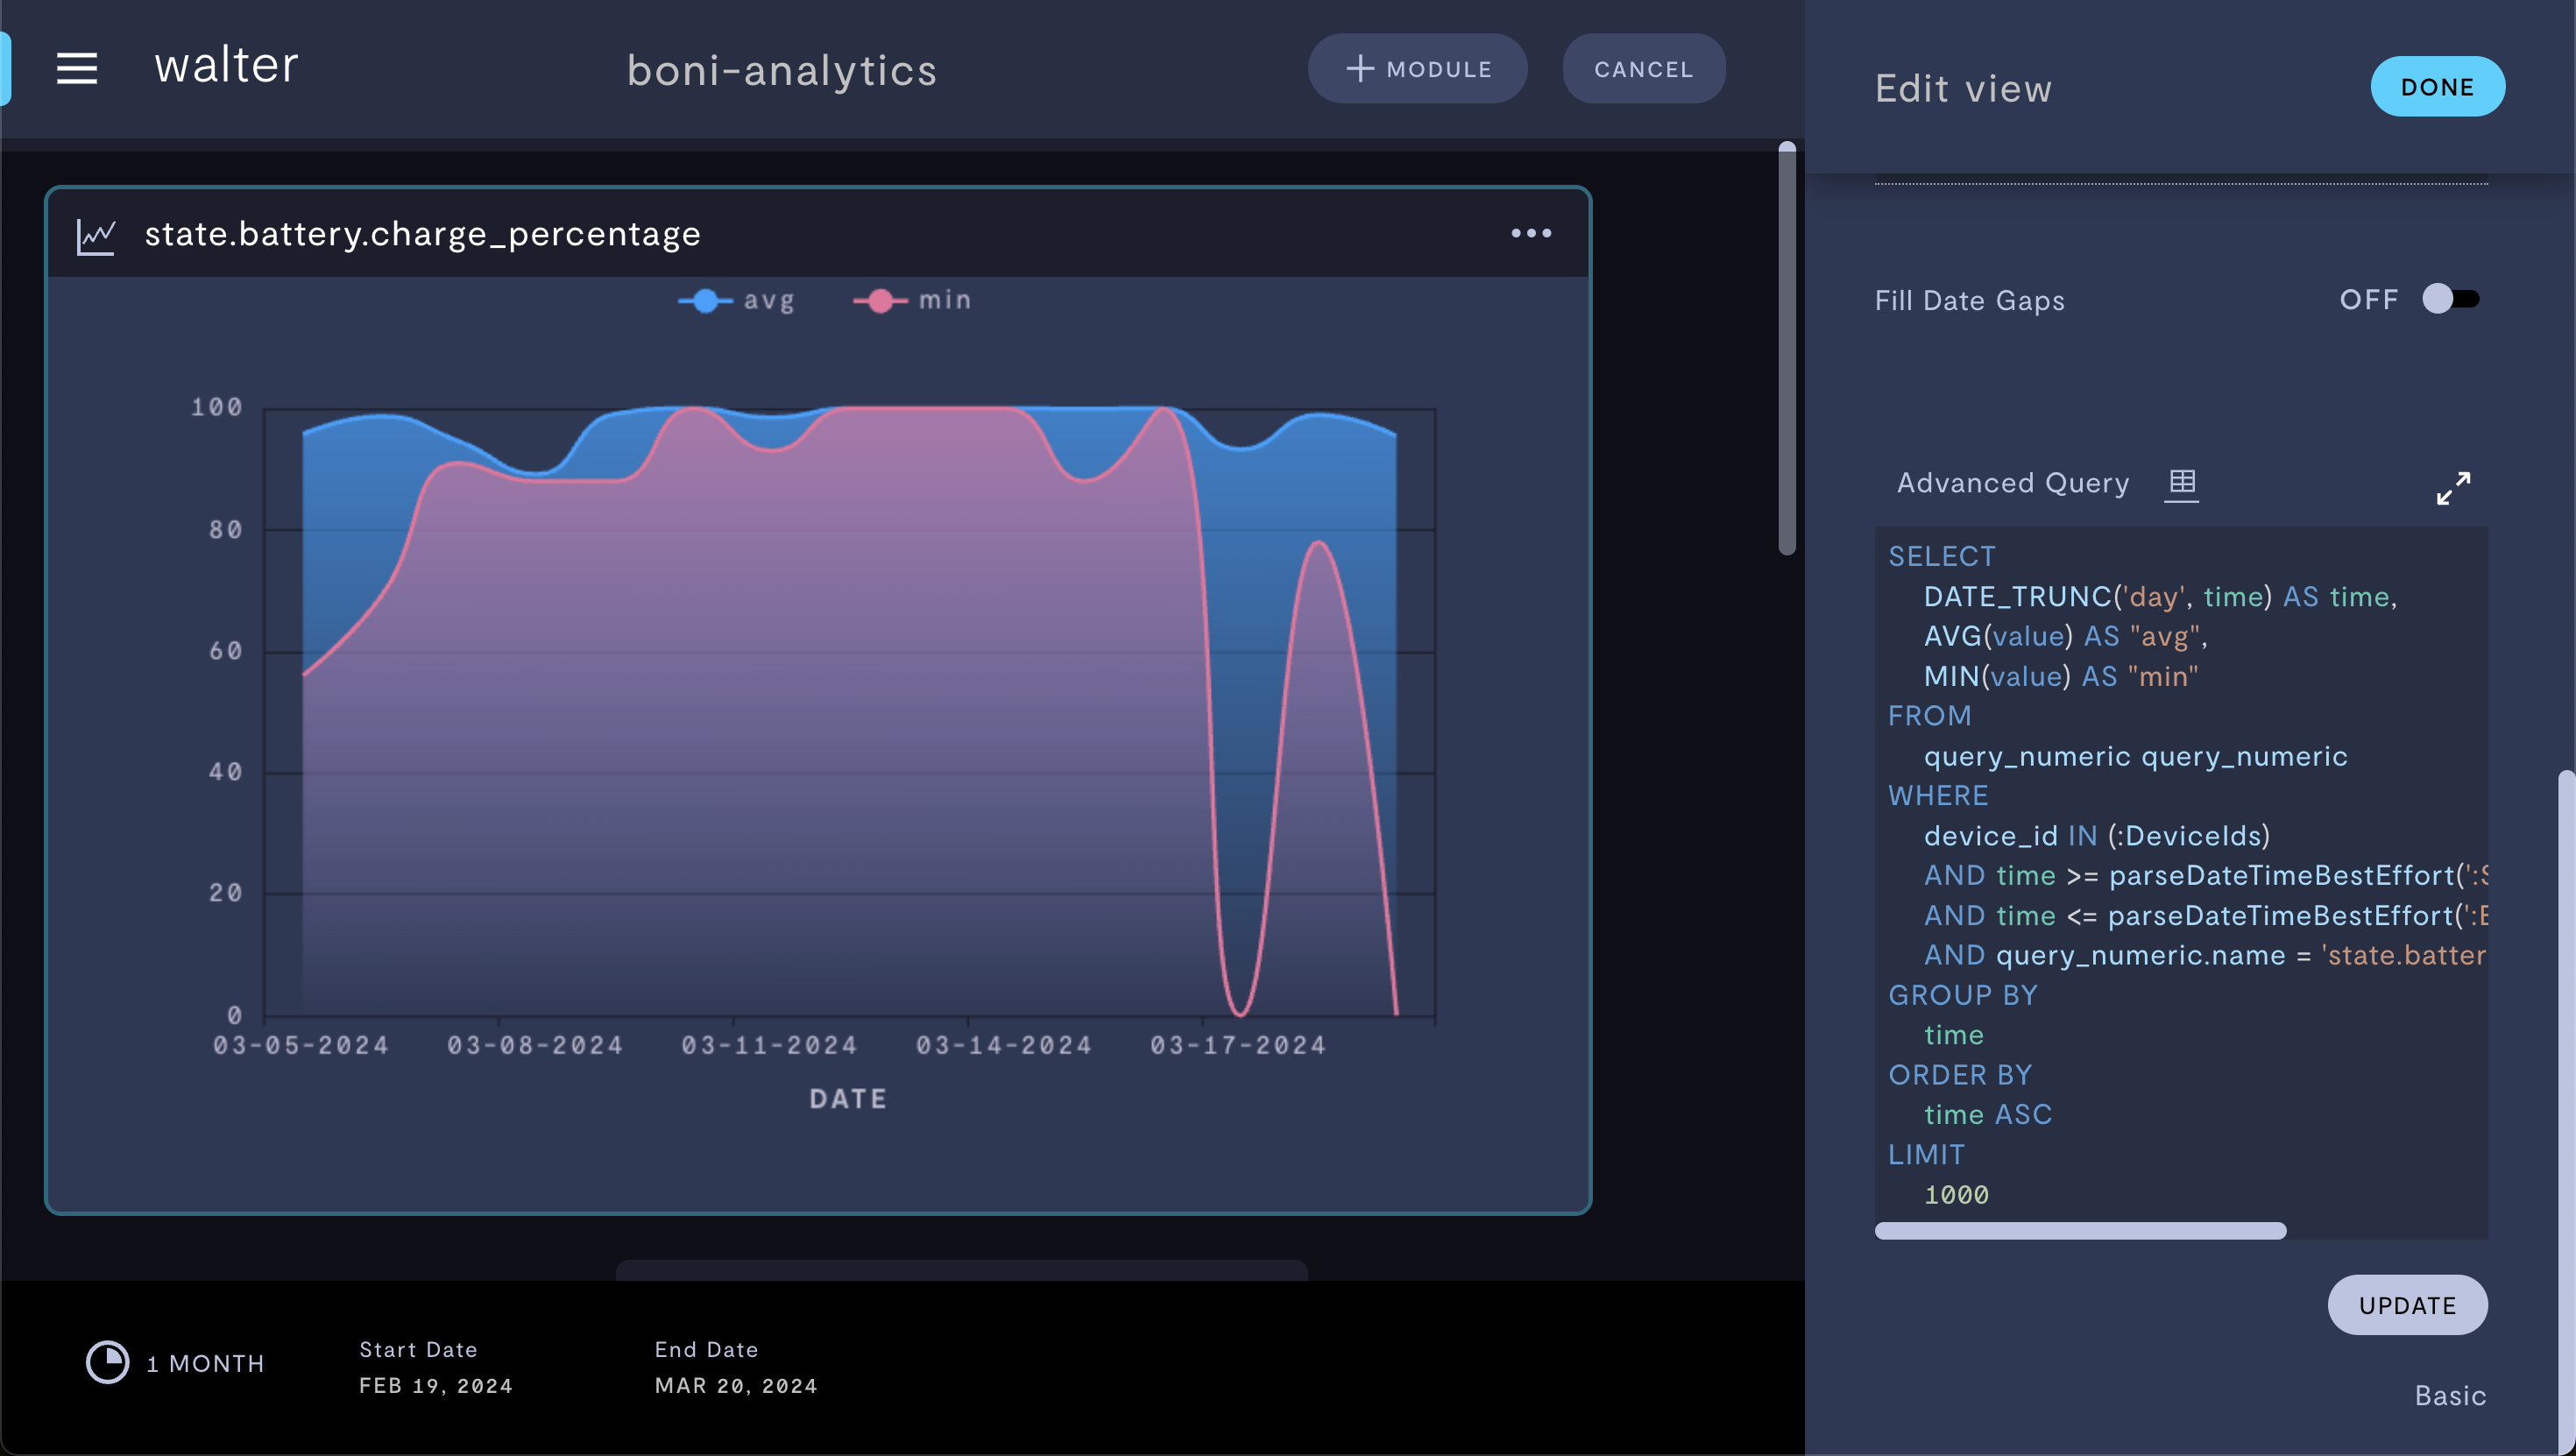
Advanced query with both minimum and average battery percentage values.
Histogram with custom x-axis
Suppose you want to visualize the number of pumpkins picked on a farm and bin them by radius. Basic visualizations in Formant Analytics only use time on the x-axis, but you can modify the basic query to customize the x-axis and create a histogram.
In the sample code below, starting from a basic query on the stream pick.radius, we removed the date from the SELECT statement, created bins 15 cm wide, and then grouped and ordered the bins by pumpkin radius.
SELECT
    "Radius(cm)",
    COUNT(*) AS "Radius (cm)"
FROM
    (
        SELECT
            CASE
                WHEN value BETWEEN 0
                AND 15 THEN '0 - 15'
                WHEN value BETWEEN 15
                AND 30 THEN '15 - 30'
                WHEN value BETWEEN 30
                AND 45 THEN '30 - 45'
                WHEN value BETWEEN 45
                AND 60 THEN '45 - 60'
                WHEN value BETWEEN 60
                AND 75 THEN '60 - 75'
                WHEN value BETWEEN 75
                AND 90 THEN '75 - 90'
                WHEN value BETWEEN 90
                AND 105 THEN '90 - 105'
                ELSE 'Other'
            END AS "Radius(cm)"
        FROM
            query_numeric query_numeric
        WHERE
            device_id IN (:DeviceIds)
            AND time >= parseDateTimeBestEffort(':StartDate')
            AND time <= parseDateTimeBestEffort(':EndDate')
            AND query_numeric.name = 'pick.radius'
        ORDER BY
            time ASC
        LIMIT
            1000
    )
GROUP BY
    "Radius (cm)"
ORDER BY
    "Radius (cm)" ASC
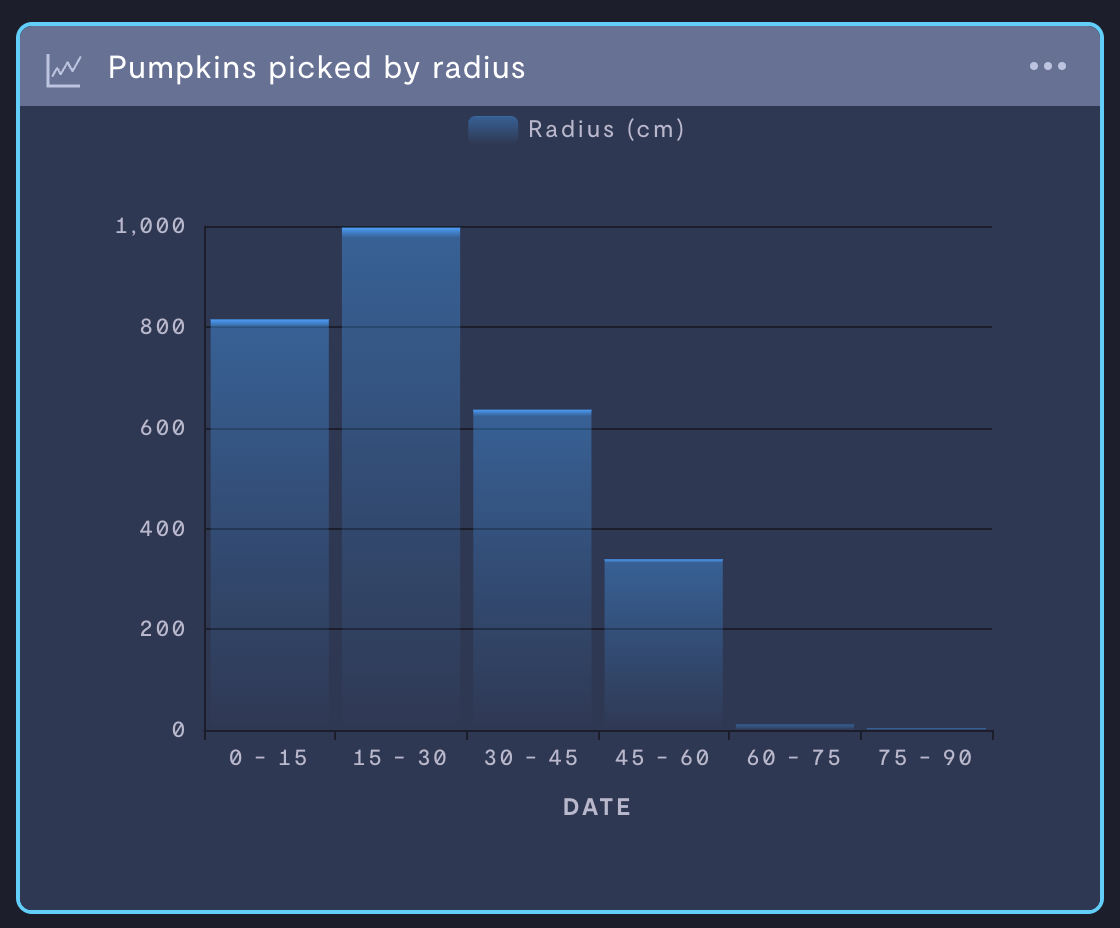
Histogram with custom x-axis bins.
Unit conversion
Suppose you want to perform a unit conversion before displaying the value in your visualization. In this case, we have a stream called pumpkins_picked.mass which is measured in grams, and want to display the value in tons.
First we created a basic query to display sum of pumpkins_picked.mass over the time range, and then applied the unit conversion of (1 ton / 907184.74 grams) to the data in our SELECT statement.
SELECT
    (SUM(value)/907184.74) AS "tons"
FROM
    query_numeric query_numeric
WHERE
    device_id IN (:DeviceIds)
    AND time >= parseDateTimeBestEffort(':StartDate')
    AND time <= parseDateTimeBestEffort(':EndDate')
    AND query_numeric.name = 'pumpkins_picked.mass'
LIMIT
    1000
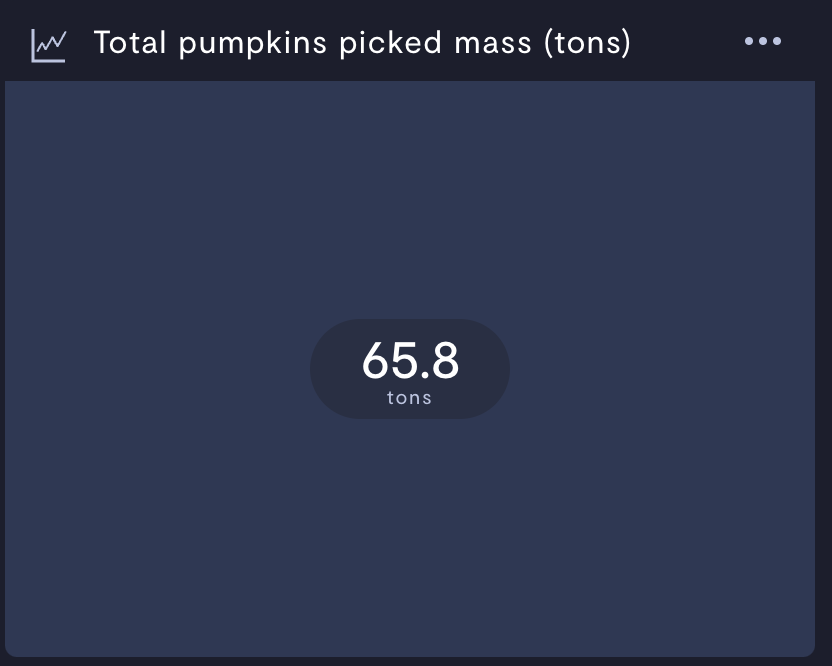
Performing a grams-to-tons unit conversion.
Filter noise from your query
Suppose you want to filter out data points below a certain threshold which might skew your aggregates. In this case, we'll remove any pumpkins which have a radius below 9 cm, and then view the average pick radius per day. We'll do this by creating a basic query on the pick.radius stream, and then editing the WHERE statement.
SELECT
    DATE_TRUNC('day', time) AS time,
    AVG(value) AS "Radius (cm)"
FROM
    query_numeric query_numeric
WHERE
    /*device_id IN (:DeviceIds)*/
    time >= parseDateTimeBestEffort(':StartDate')
    AND time <= parseDateTimeBestEffort(':EndDate')
    AND query_numeric.name = 'Radius (cm)'
    AND value > 9
GROUP BY
    time
ORDER BY
    time ASC
LIMIT
    1000
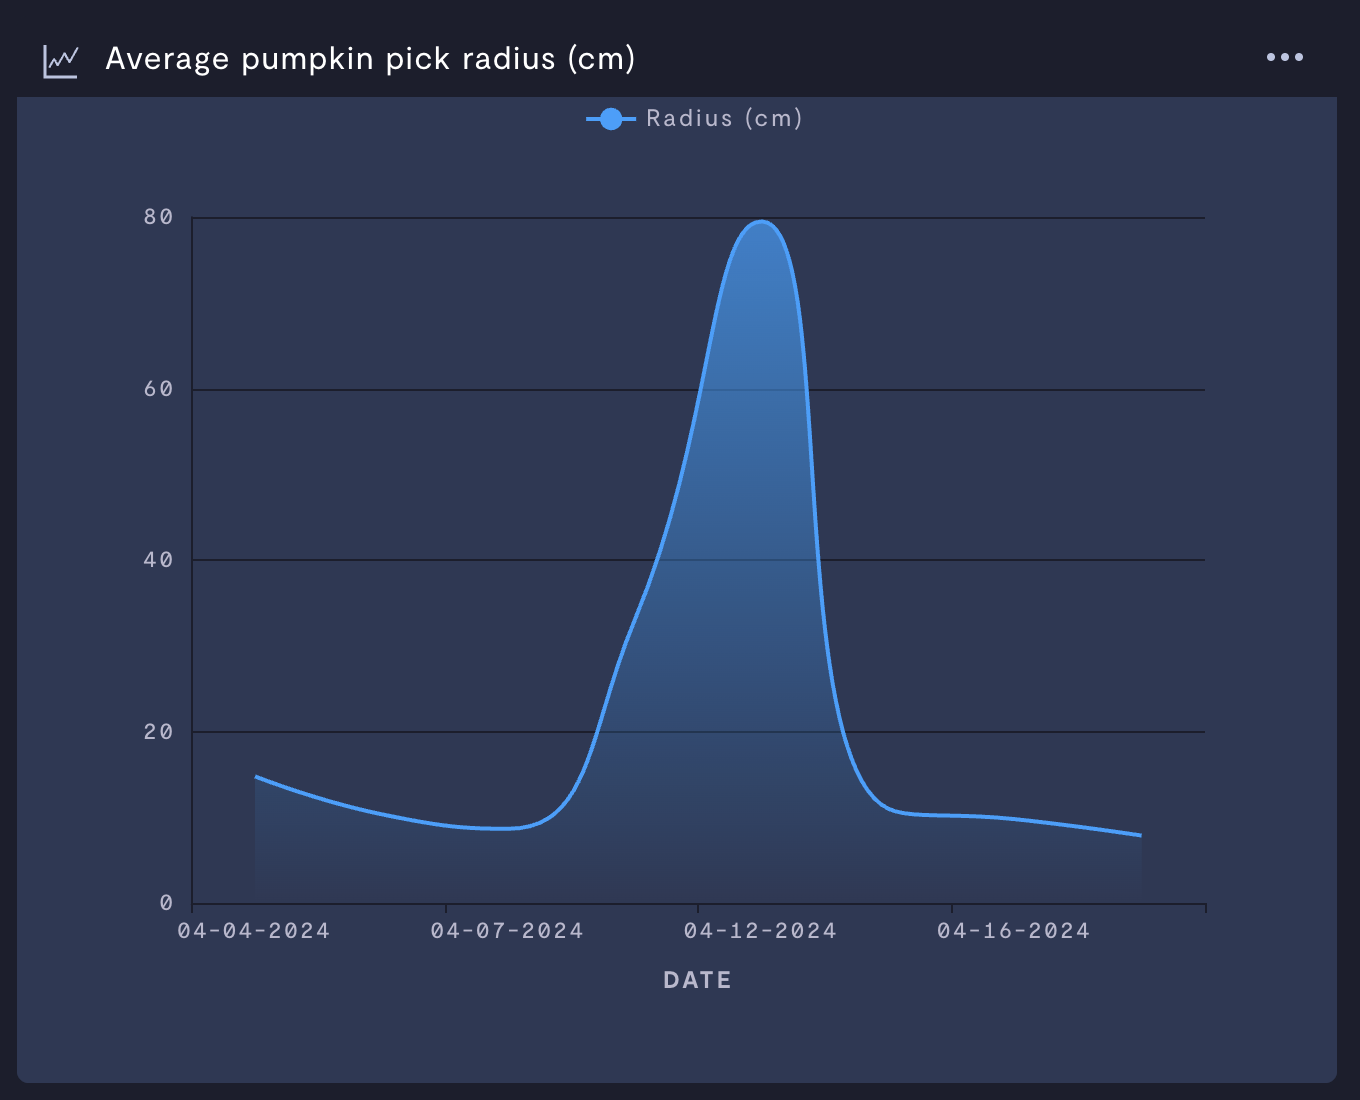
Average values with noise filtered out.
If you notice an issue with this page or need help, please reach out to us! Use the 'Did this page help you?' buttons below, or get in contact with our Customer Success team via the Intercom messenger in the bottom-right corner of this page, or at [email protected].
Updated 6 days ago